IDEA-Health 2026: Integrating Demography, Epidemiology & Analytics
From February 25 to 27, 2026, I had the privilege of attending the IDEA-Health 2026 workshop, organized by the Division of Medical Research at SRM Medical College Hospital & Research Centre. The three-day capacity-building workshop was designed to strengthen foundations in health research by integrating demography, epidemiology, and analytics.
Reunion and the Medical Research Lab Tour
One of the highlights of the workshop occurred on the very first day when I was reunited with Dr. Pragathi, my super senior from my undergraduate days at Sarada Krishna Homoeopathic Medical College. She had recently joined SRM as part of a CCRH Research Project, and it was wonderful to attend the sessions alongside her over the three days.
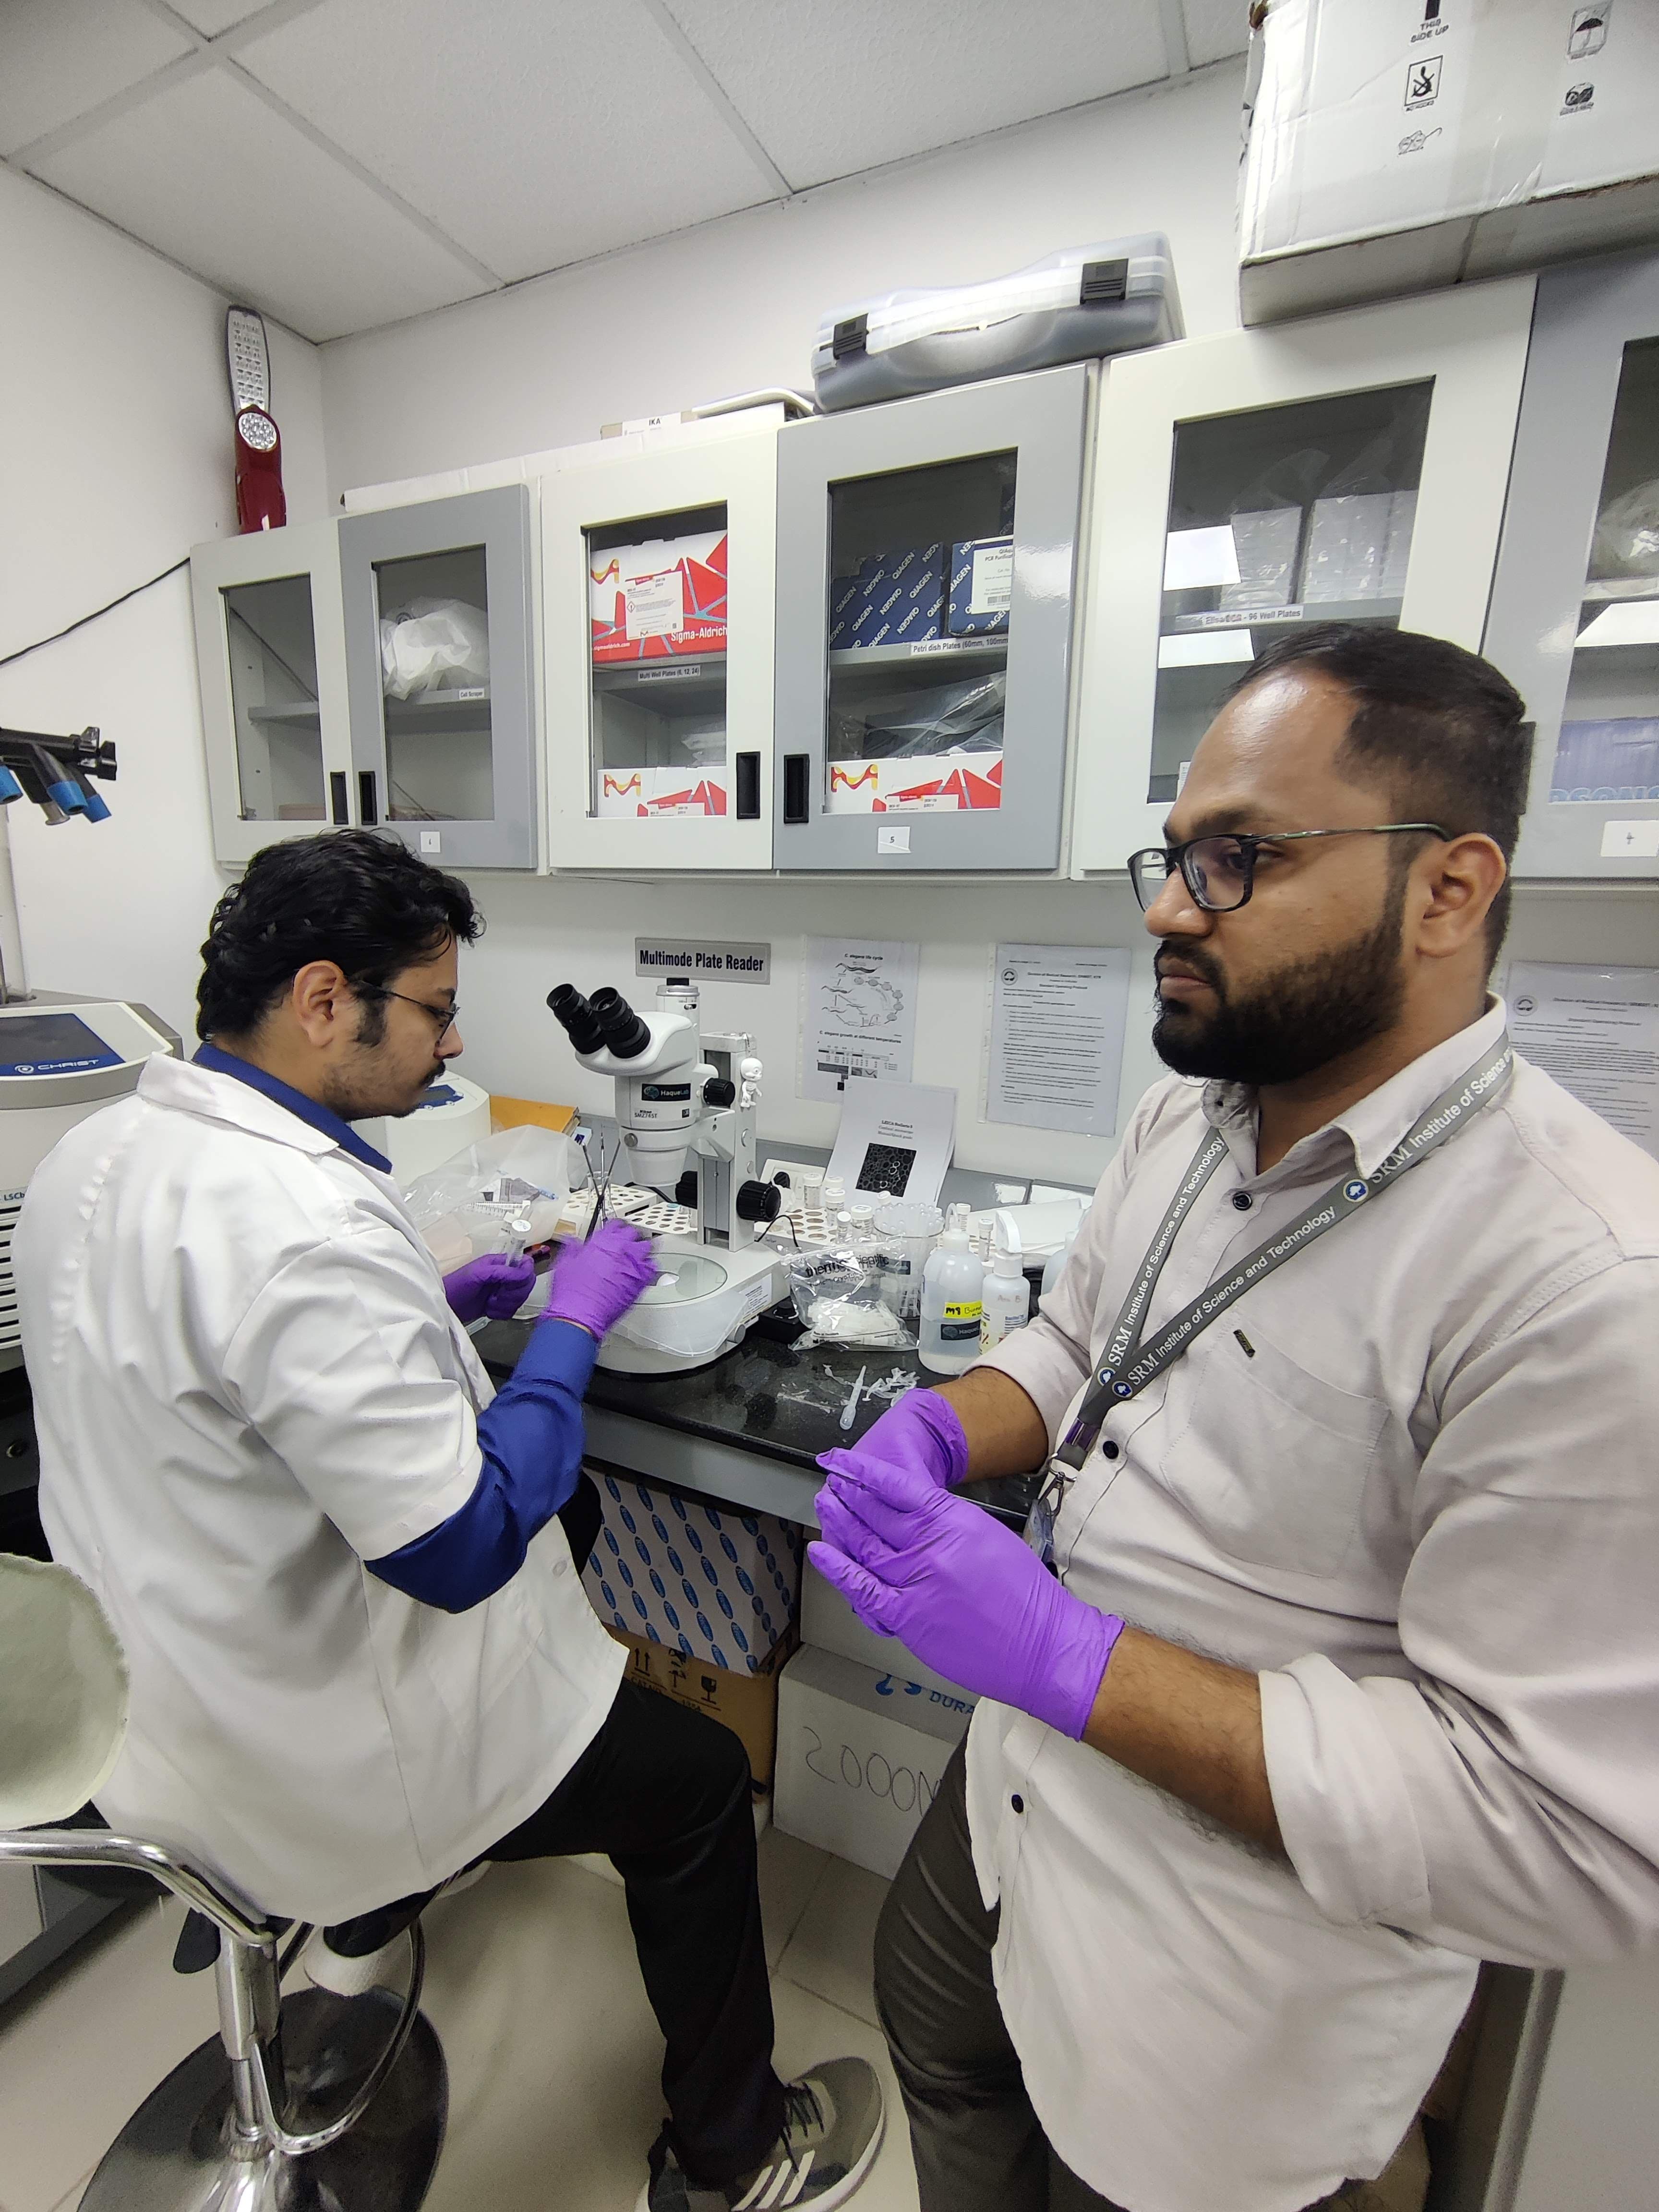
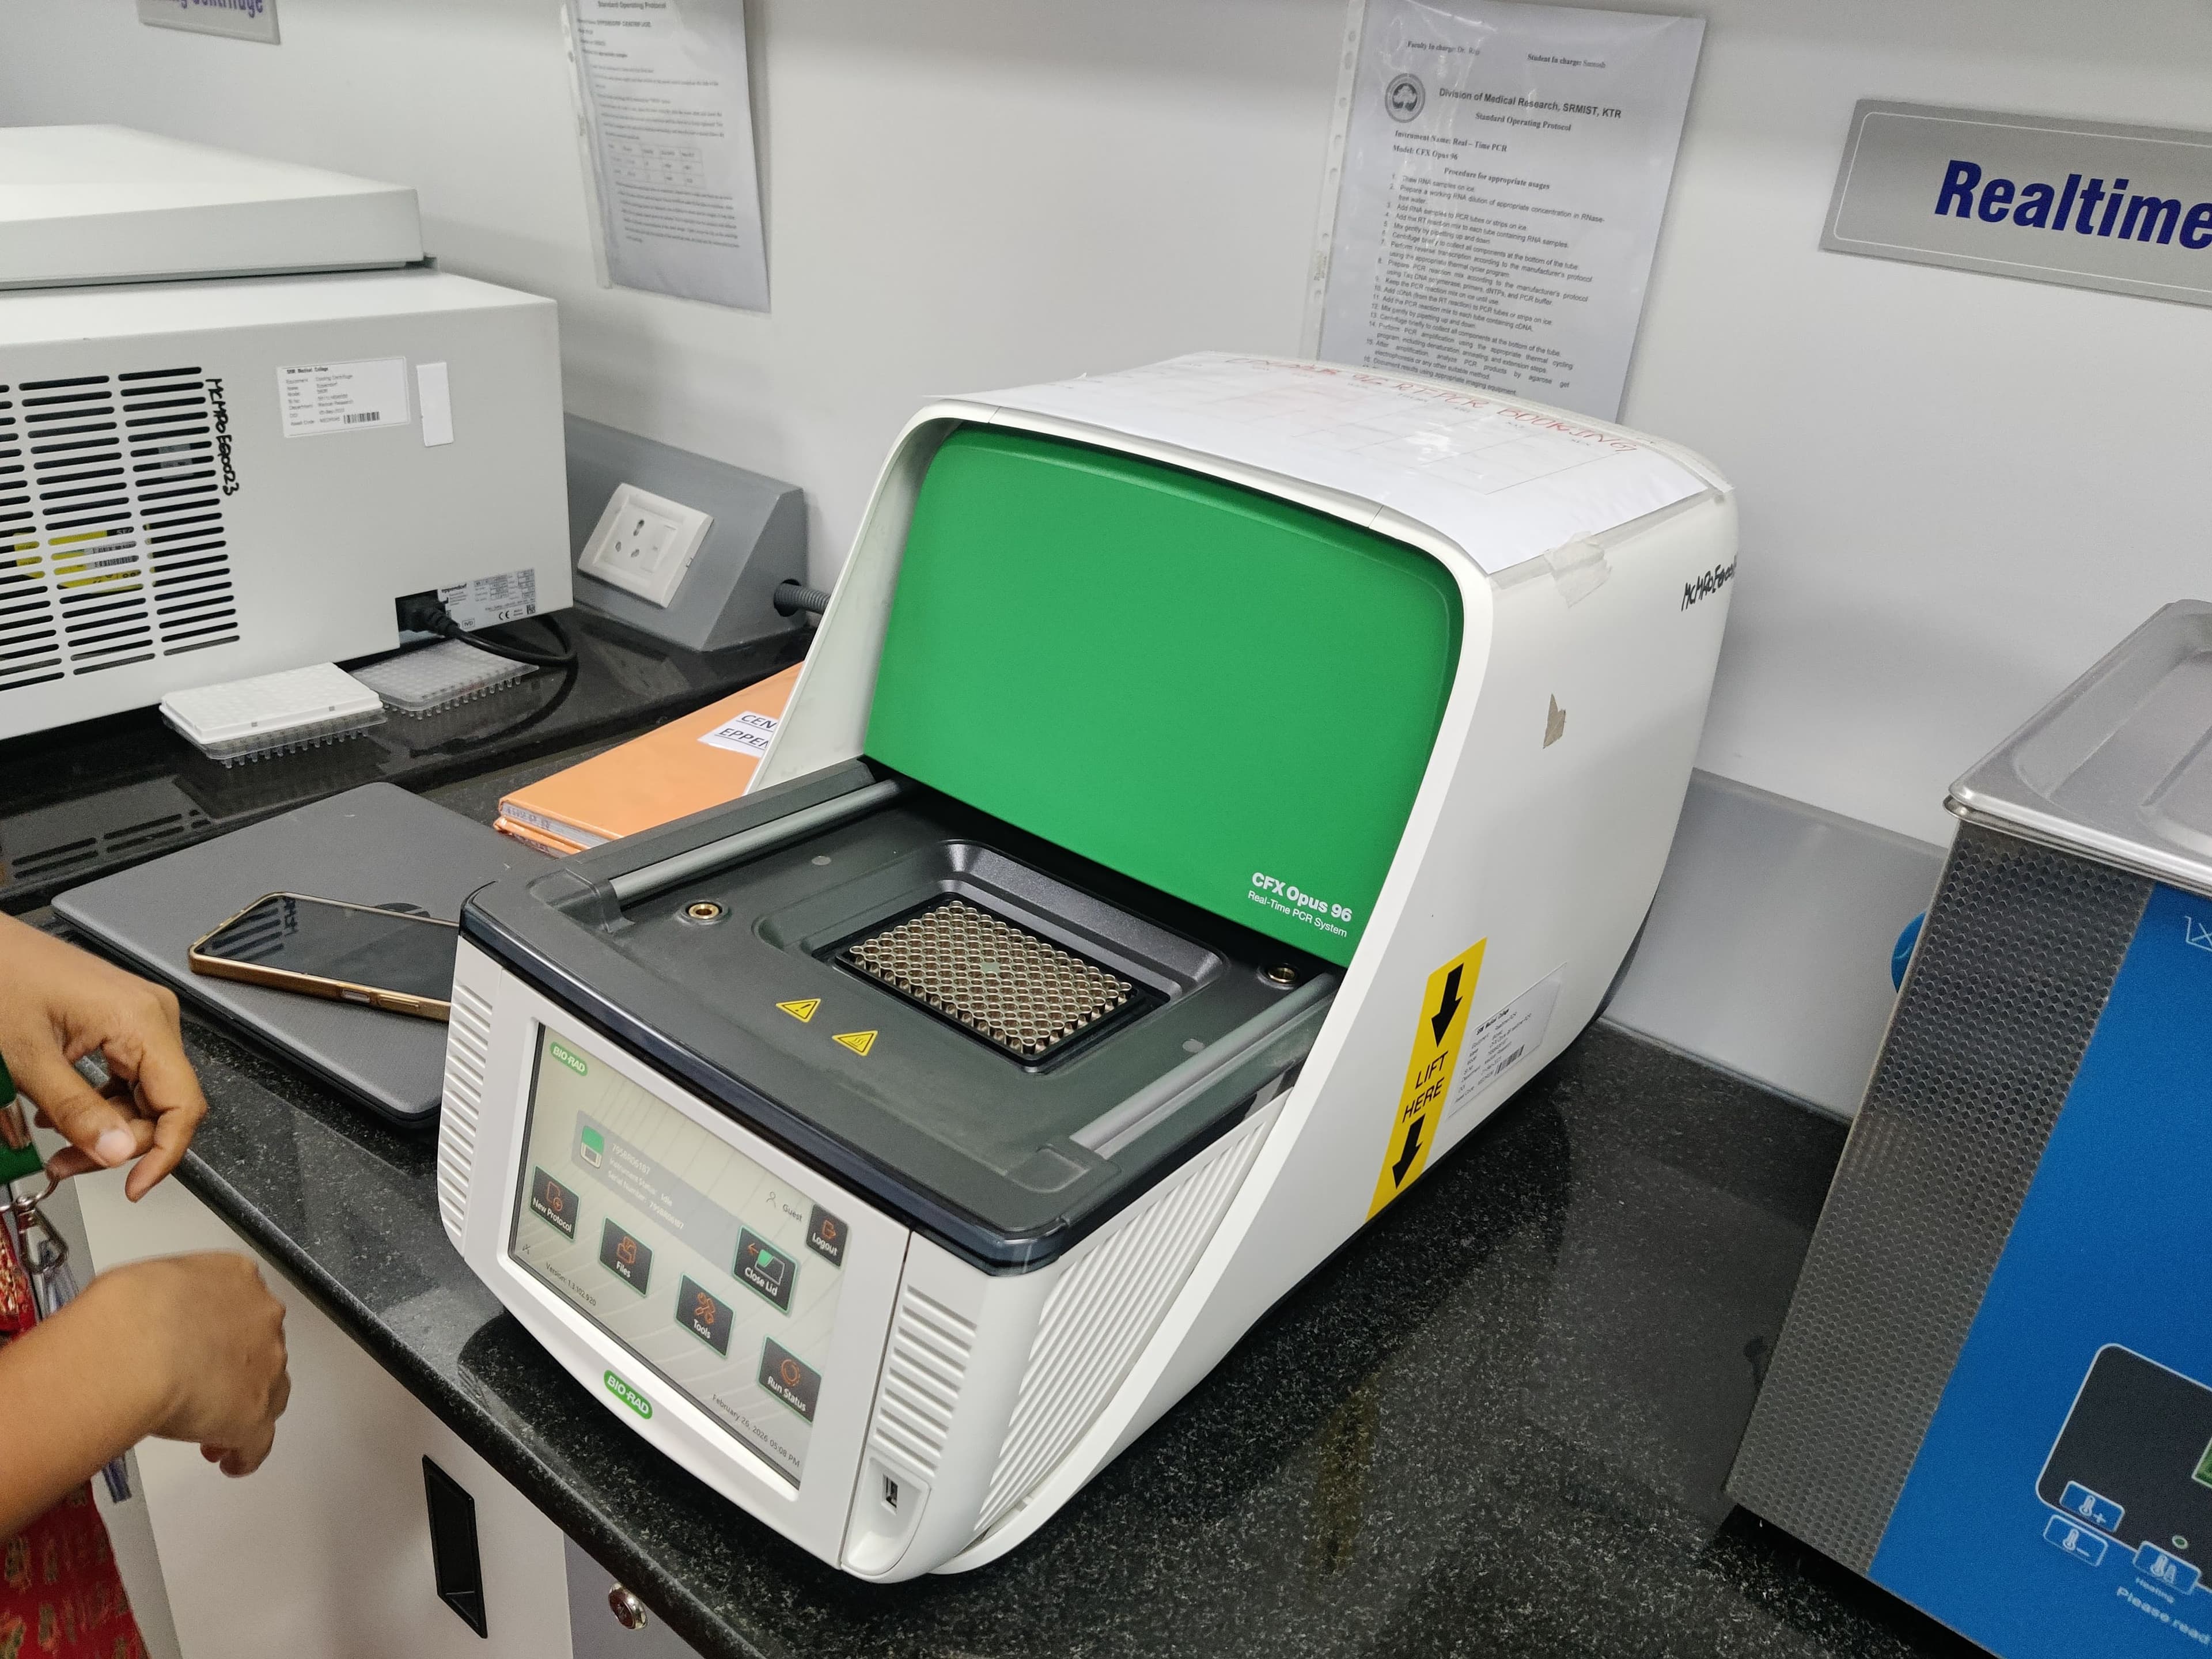
Thanks to her working in the Medical Research Department, she arranged for the scientists and researchers to give me a comprehensive tour of the Medical Research Lab. Exploring the various advanced tools and setups they use for clinical research was an amazing, eye-opening experience that added a practical dimension to the theoretical knowledge gained during the formal sessions.
Key Learnings & Takeaways
The workshop combined expert-led lectures and hands-on sessions. I jotted down several vital insights across the different domains of health research:
Health Research & Study Design
Dr. Alex Joseph set the stage by emphasizing that health research should never be limited to surface-level understanding, nor should it be just a "statistics first" approach.
Dr. Nawaj Sarif delved into research design, warning us of the Cobra Effect—how a poorly designed study or intervention can lead to worse outcomes. He highlighted the distinction between causation and correlation and introduced concepts like Participatory Action Research to gain hands-on perspective from field activities.
Navigating Epidemiology & Demography
Dr. Soumitra Ghosh gave a fascinating session on data types—breaking down cross-sectional (surveys), time series (data over time), and panel data (hybrid). A major takeaway was the strategic use of secondary data. Secondary data saves immense cleaning time, but it demands a crystal-clear research question to be useful. We also explored crucial Indian demographic datasets:
- NFHS (National Family Health Survey)
- SRS (Sample Registration System)
- NNMB (National Nutrition Monitoring Bureau) – crucial for micronutrients and biological data.
- LASI (Longitudinal Ageing Survey of India) – specialized for geriatric data.
He also clarified the fundamental difference between a Census (covering everyone) and a Survey (covering a sample group).
Demystifying Qualitative Data
Dr. Snigdha Banerjee highlighted how qualitative data substantiates quantitative data by answering the "how," "what," and "why" through an emotional lens. Techniques like in-depth interviews capture personal thoughts, while case studies focus on specific cases and their surrounding context. We even discussed the "Mystery Client" method for organically evaluating healthcare facilities.
The session practically demonstrated how to process qualitative transcripts:
- Verbatim Transcript
- Codes (e.g., Introvert, Shy)
- Themes (e.g., Inability of patient to connect with Doctor)
- Theory Generation
We learned about Deductive (fitting data to existing theories) versus Inductive (generating themes from the transcript) methods, and later had hands-on training with NVivo for managing datasets and classifying ideas.
The Mathematics of Research: Biostatistics
Dr. A. H. Sruthi Anil Kumar brilliantly uncoupled biostatistics. She simplified crucial distinctions:
- Rate: Numerator is a subset of the denominator (units differ).
- Ratio: Compares independent things with the same unit, making them excellent for cross-study comparisons.
- Proportion & Percentage: Simple slices of the whole.
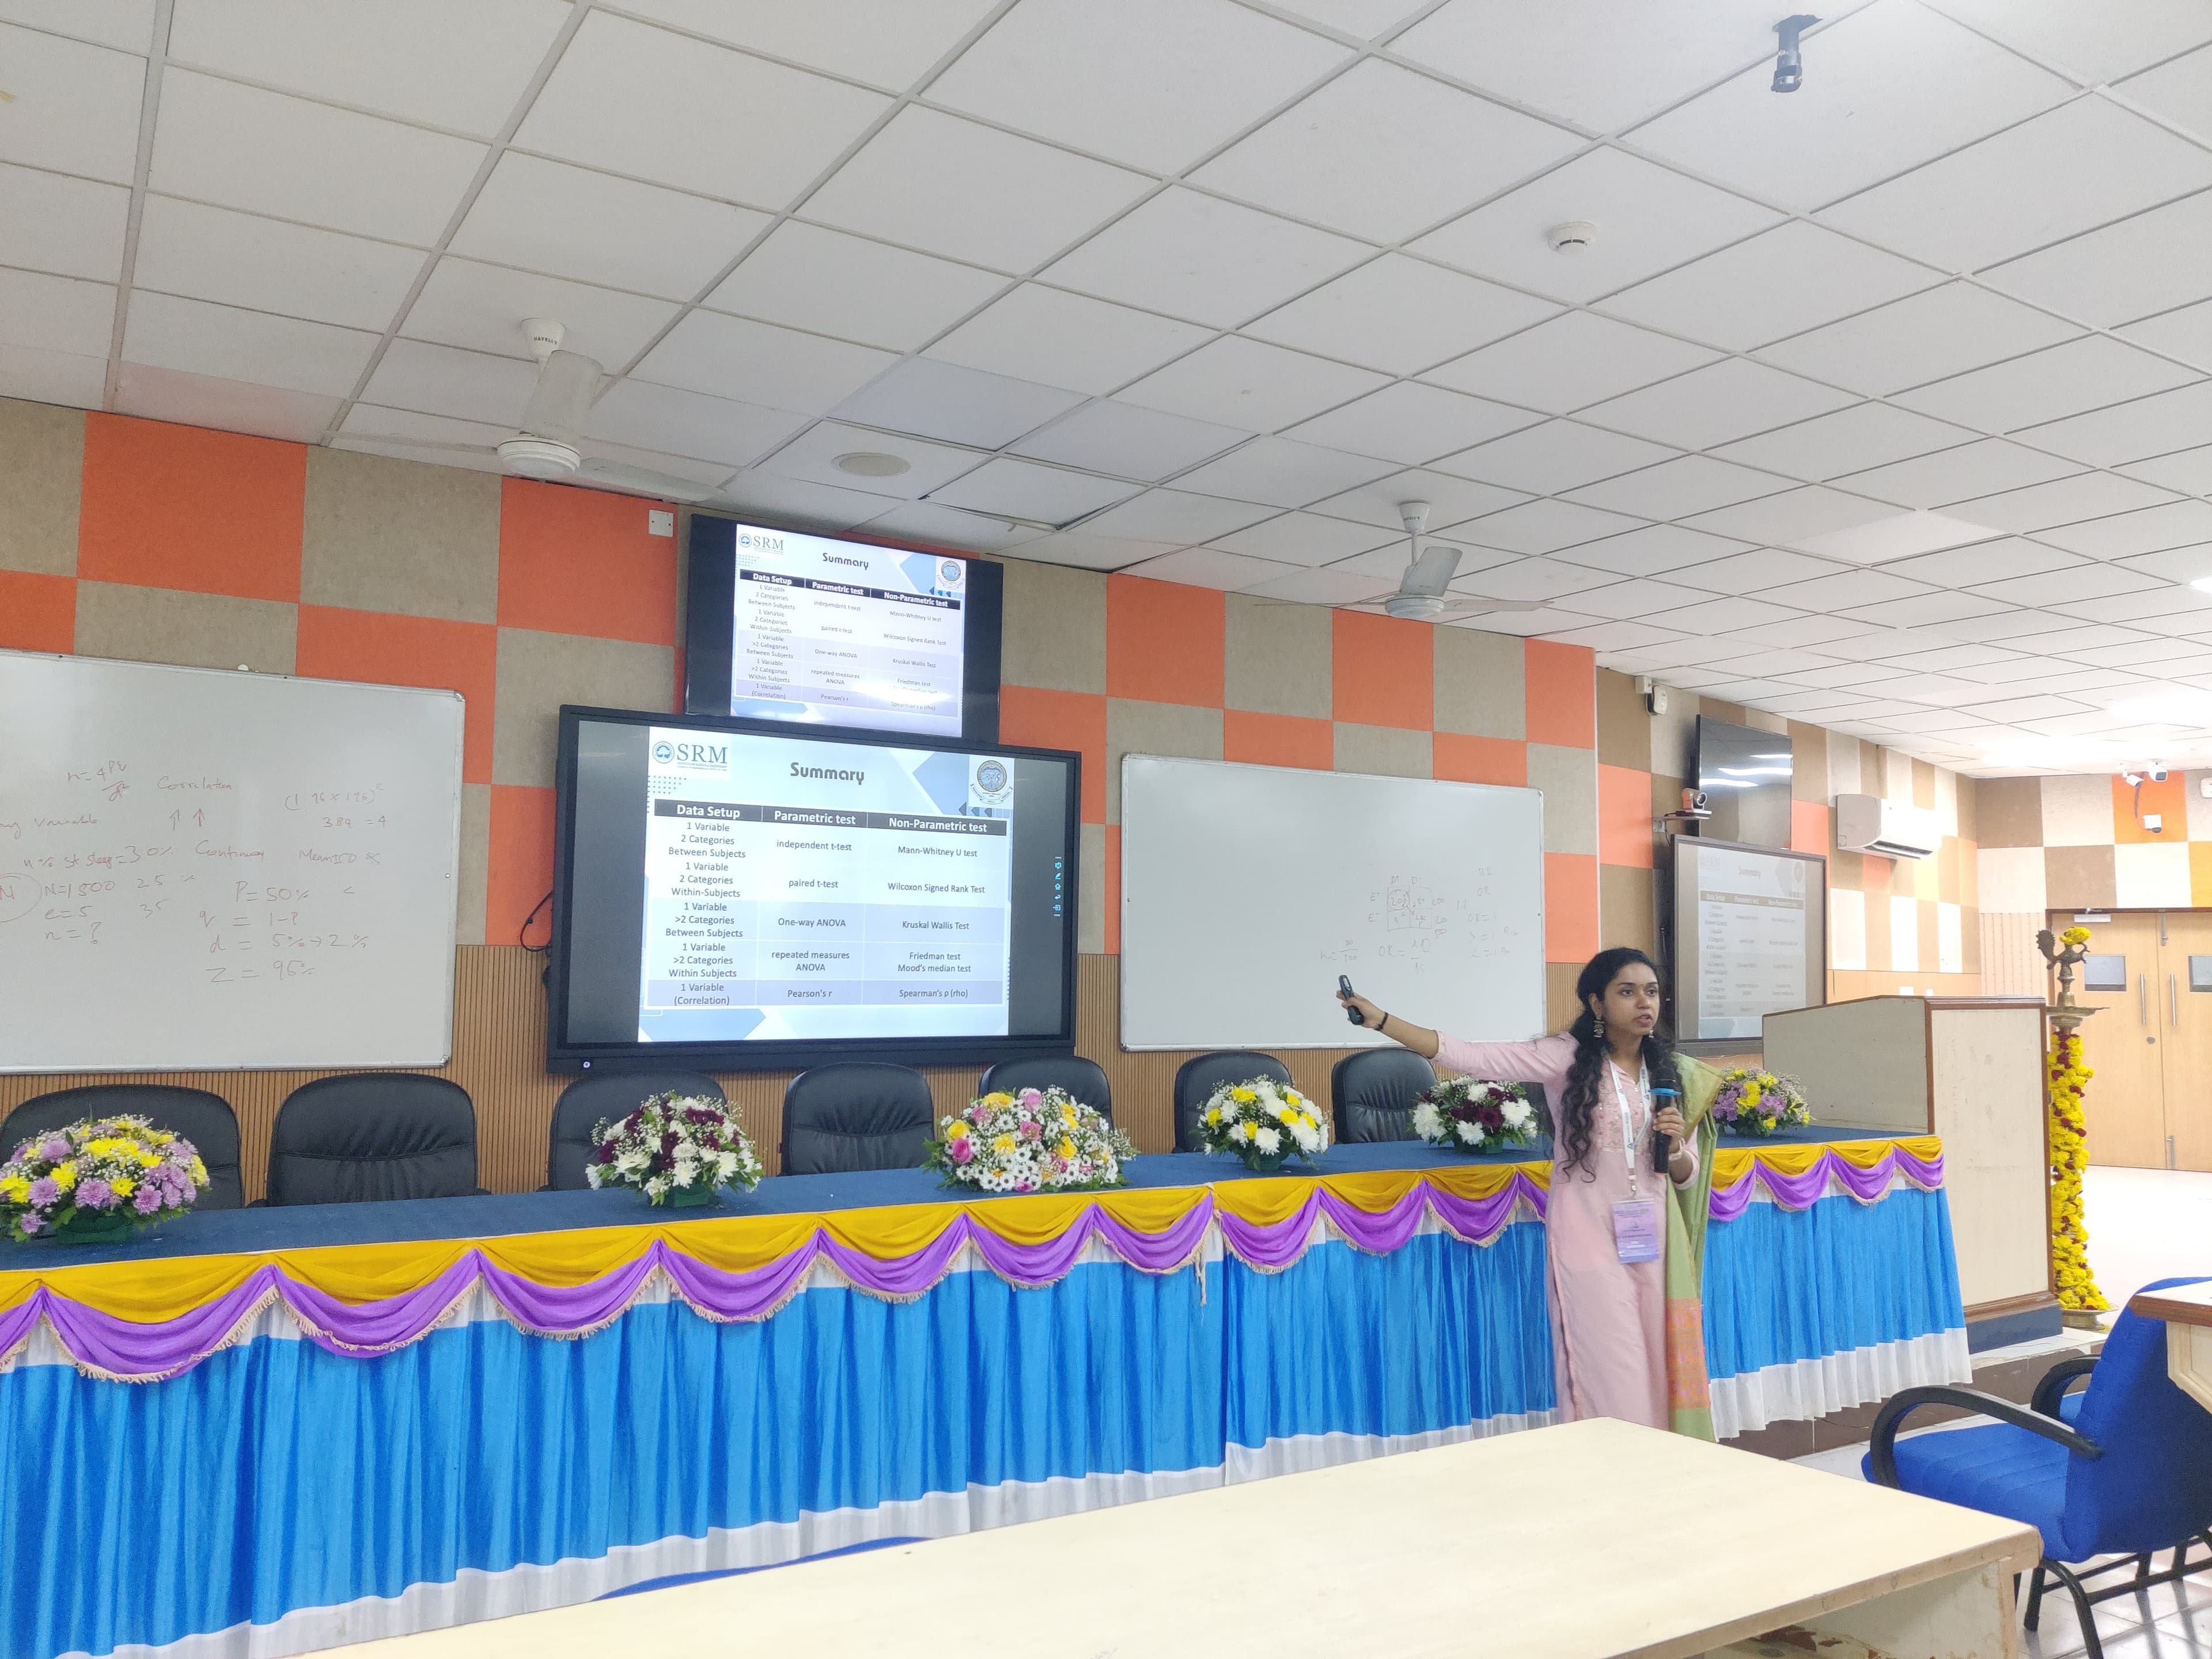
We covered variables heavily: Nominal (names), Ordinal (scales), and Metric (measurable). The session offered clear rules for test selection:
- Parametric Tests (normal distribution): t-tests, ANOVA.
- Non-Parametric Tests (not normal): Mann-Whitney U, Kruskal-Wallis.
- Regression Analysis: Linear (2 continuous variables), Multiple Linear (3+ variables), and Logistic (binary outcomes like Yes/No).
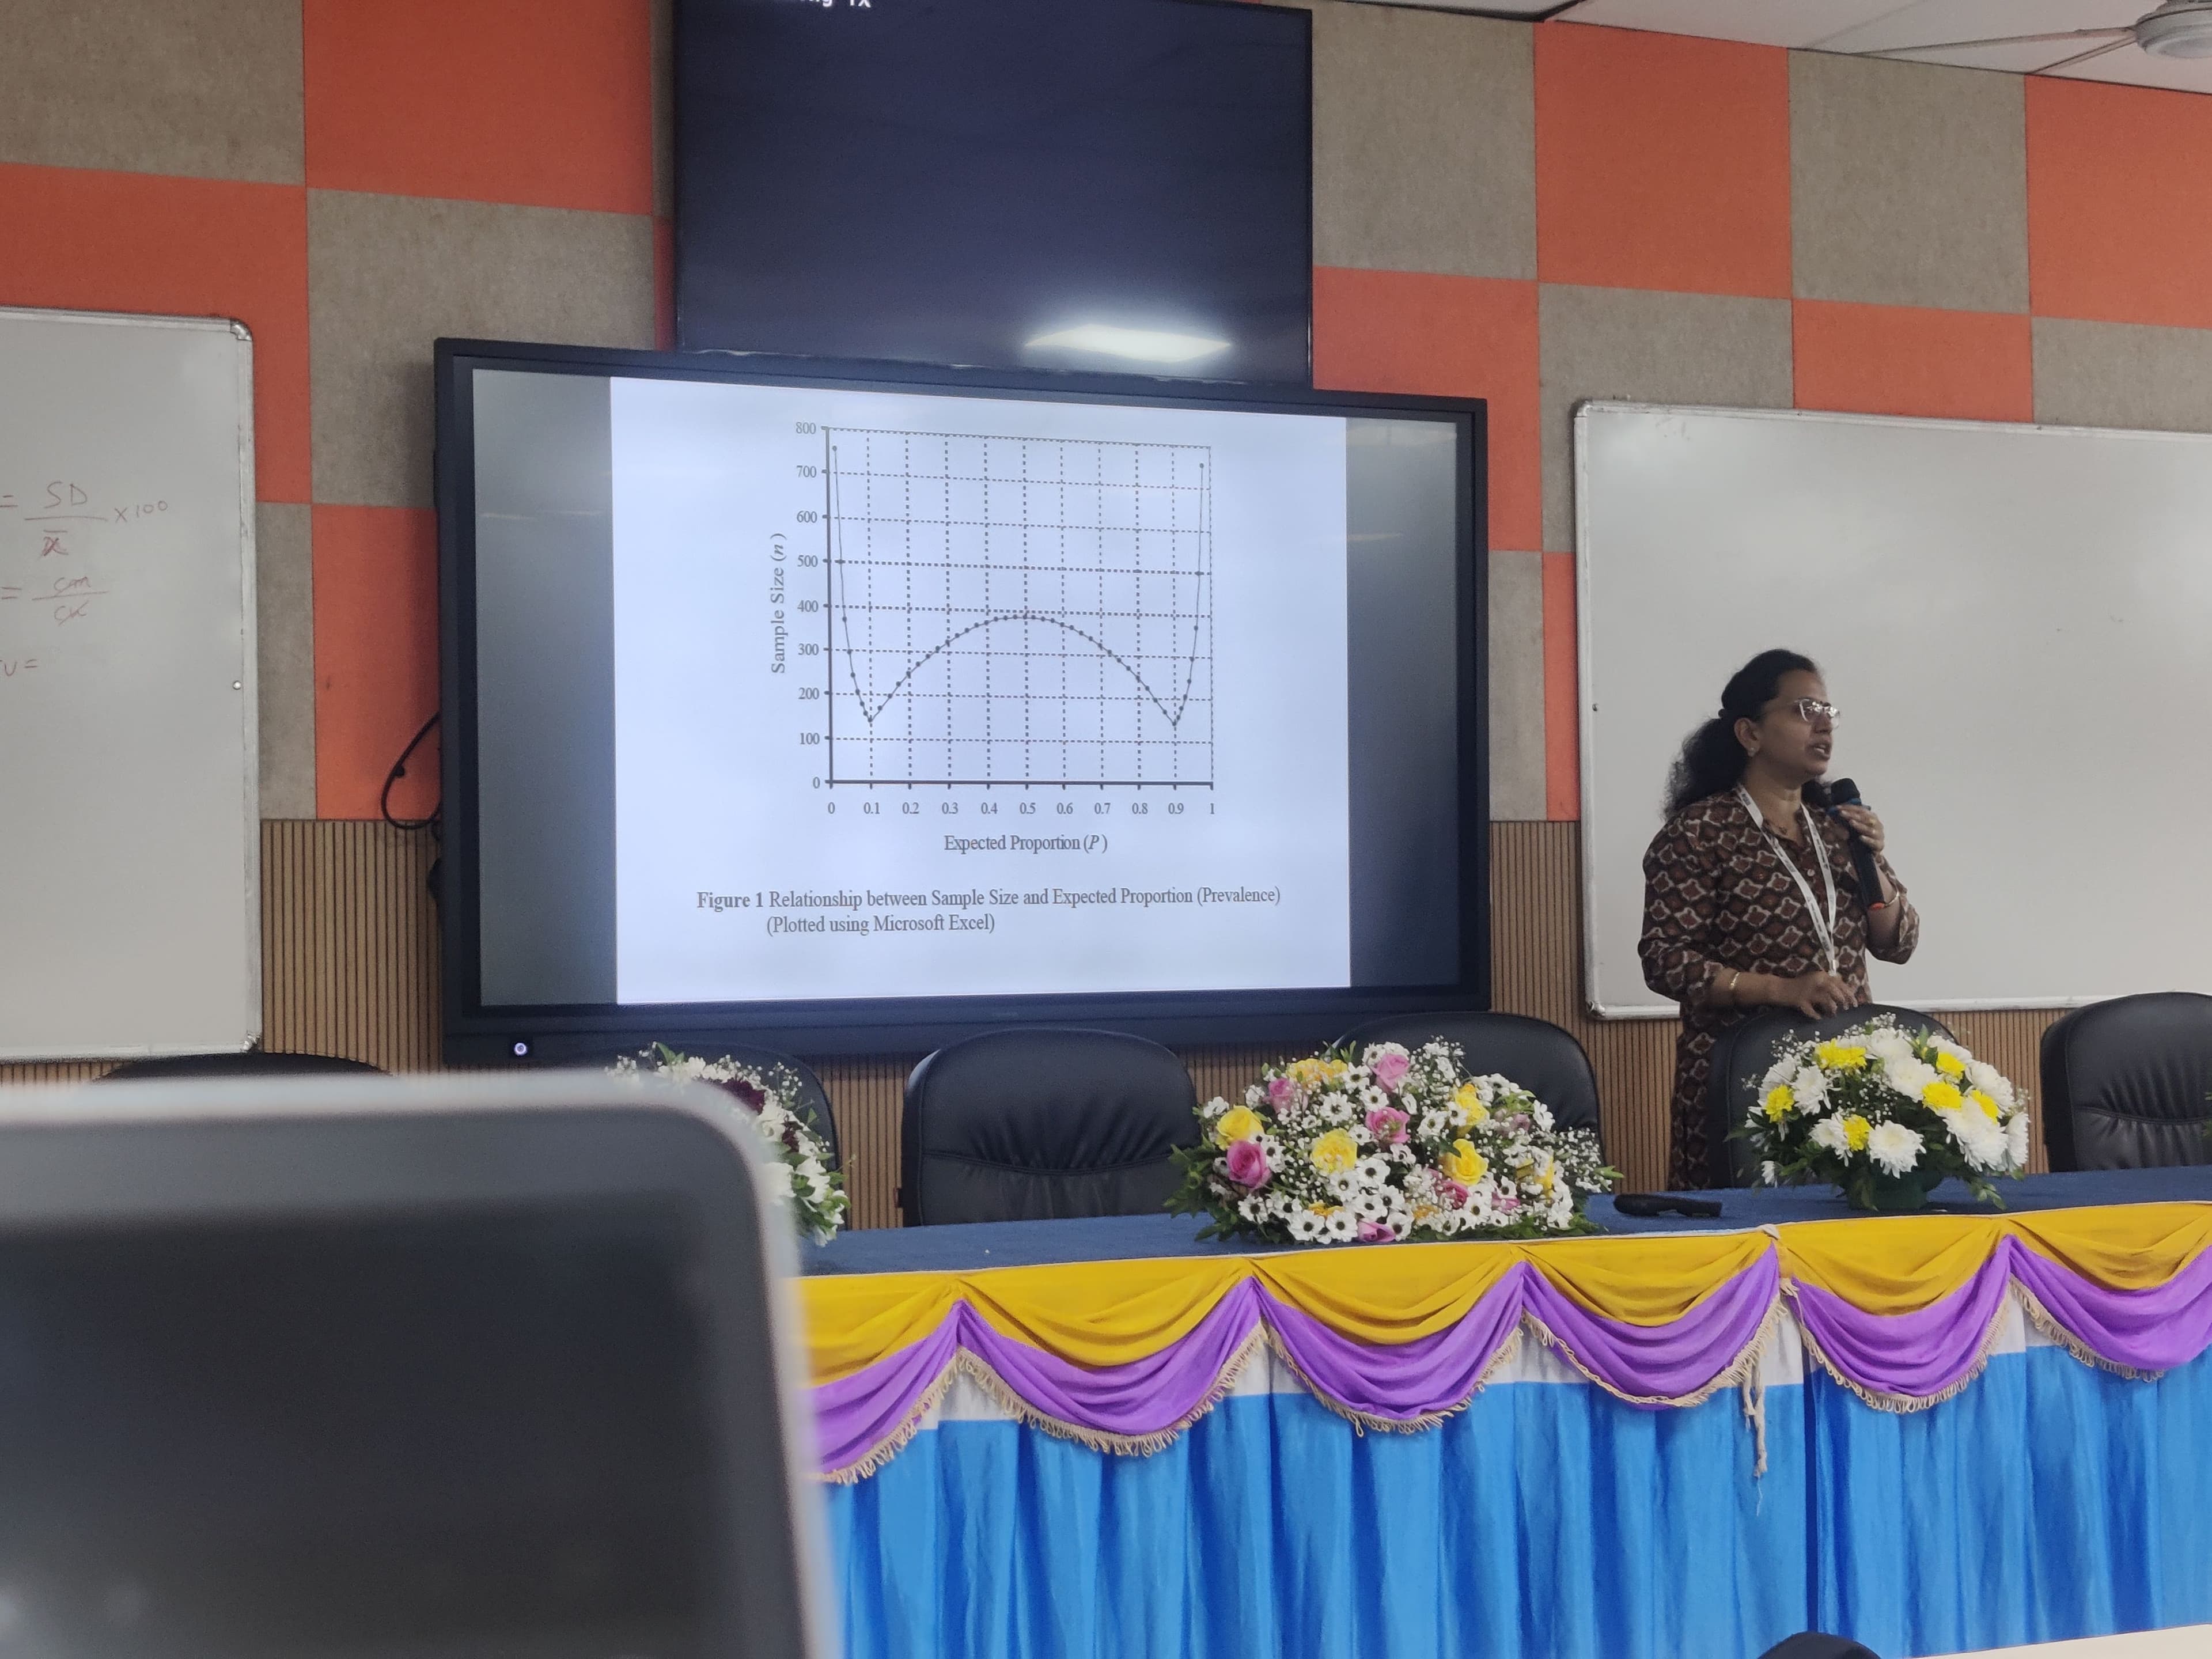
Sample Size Estimation
Dr. Dhasarathi Kumar and Dr. Priyanka Dixit tackled sample size. The golden rule is calculating it based on the primary objective. If a study has multiple objectives yielding different sizes, we always adopt the higher sample size to satisfy all parameters.
We explored the mathematics behind the Margin of Error, Confidence Intervals (typically 95%), and the Coefficient of Variation, a unitless value perfect for comparing variances across groups with conflicting unit measurements.
IDEA-Health 2026 was a holistic experience that significantly enhanced my capacity to handle real-world health research datasets, select appropriate methodologies, and most importantly, ask the right research questions.
Gallery

Reunion with Dr. Pragathi
Exploring Medical Research Facilities
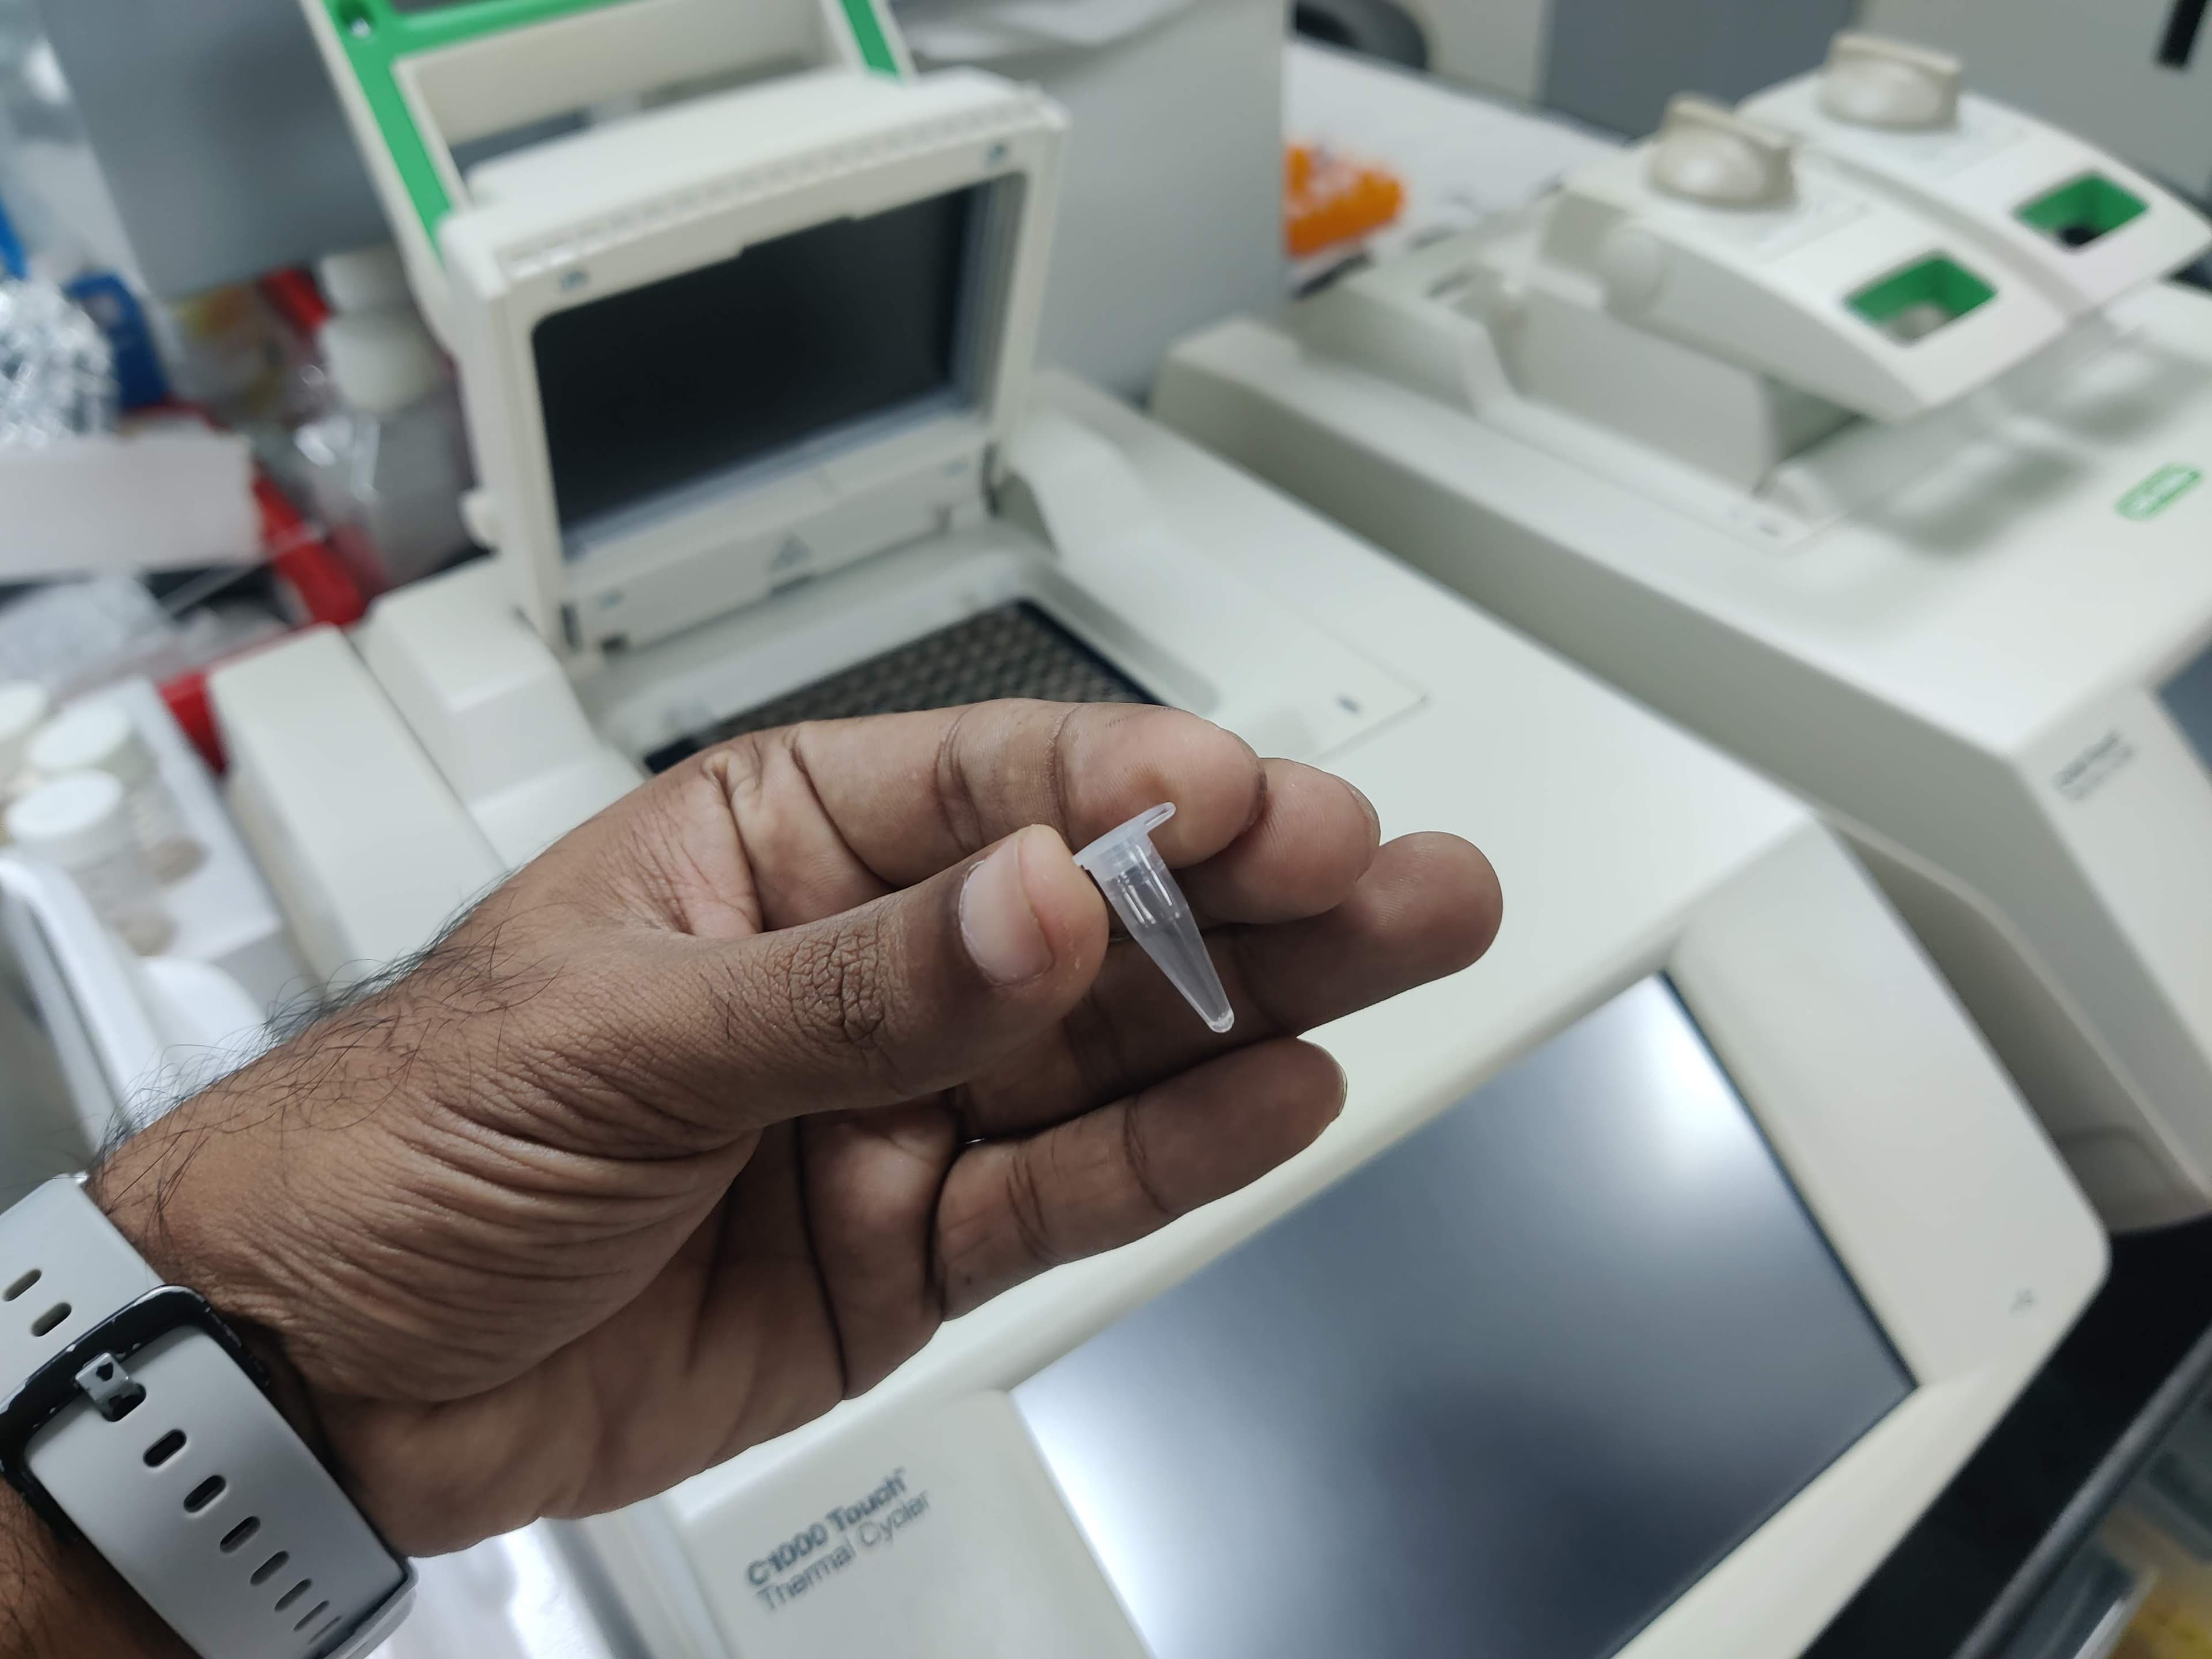
Medical Research Lab Tour
Medical Research Lab Tour
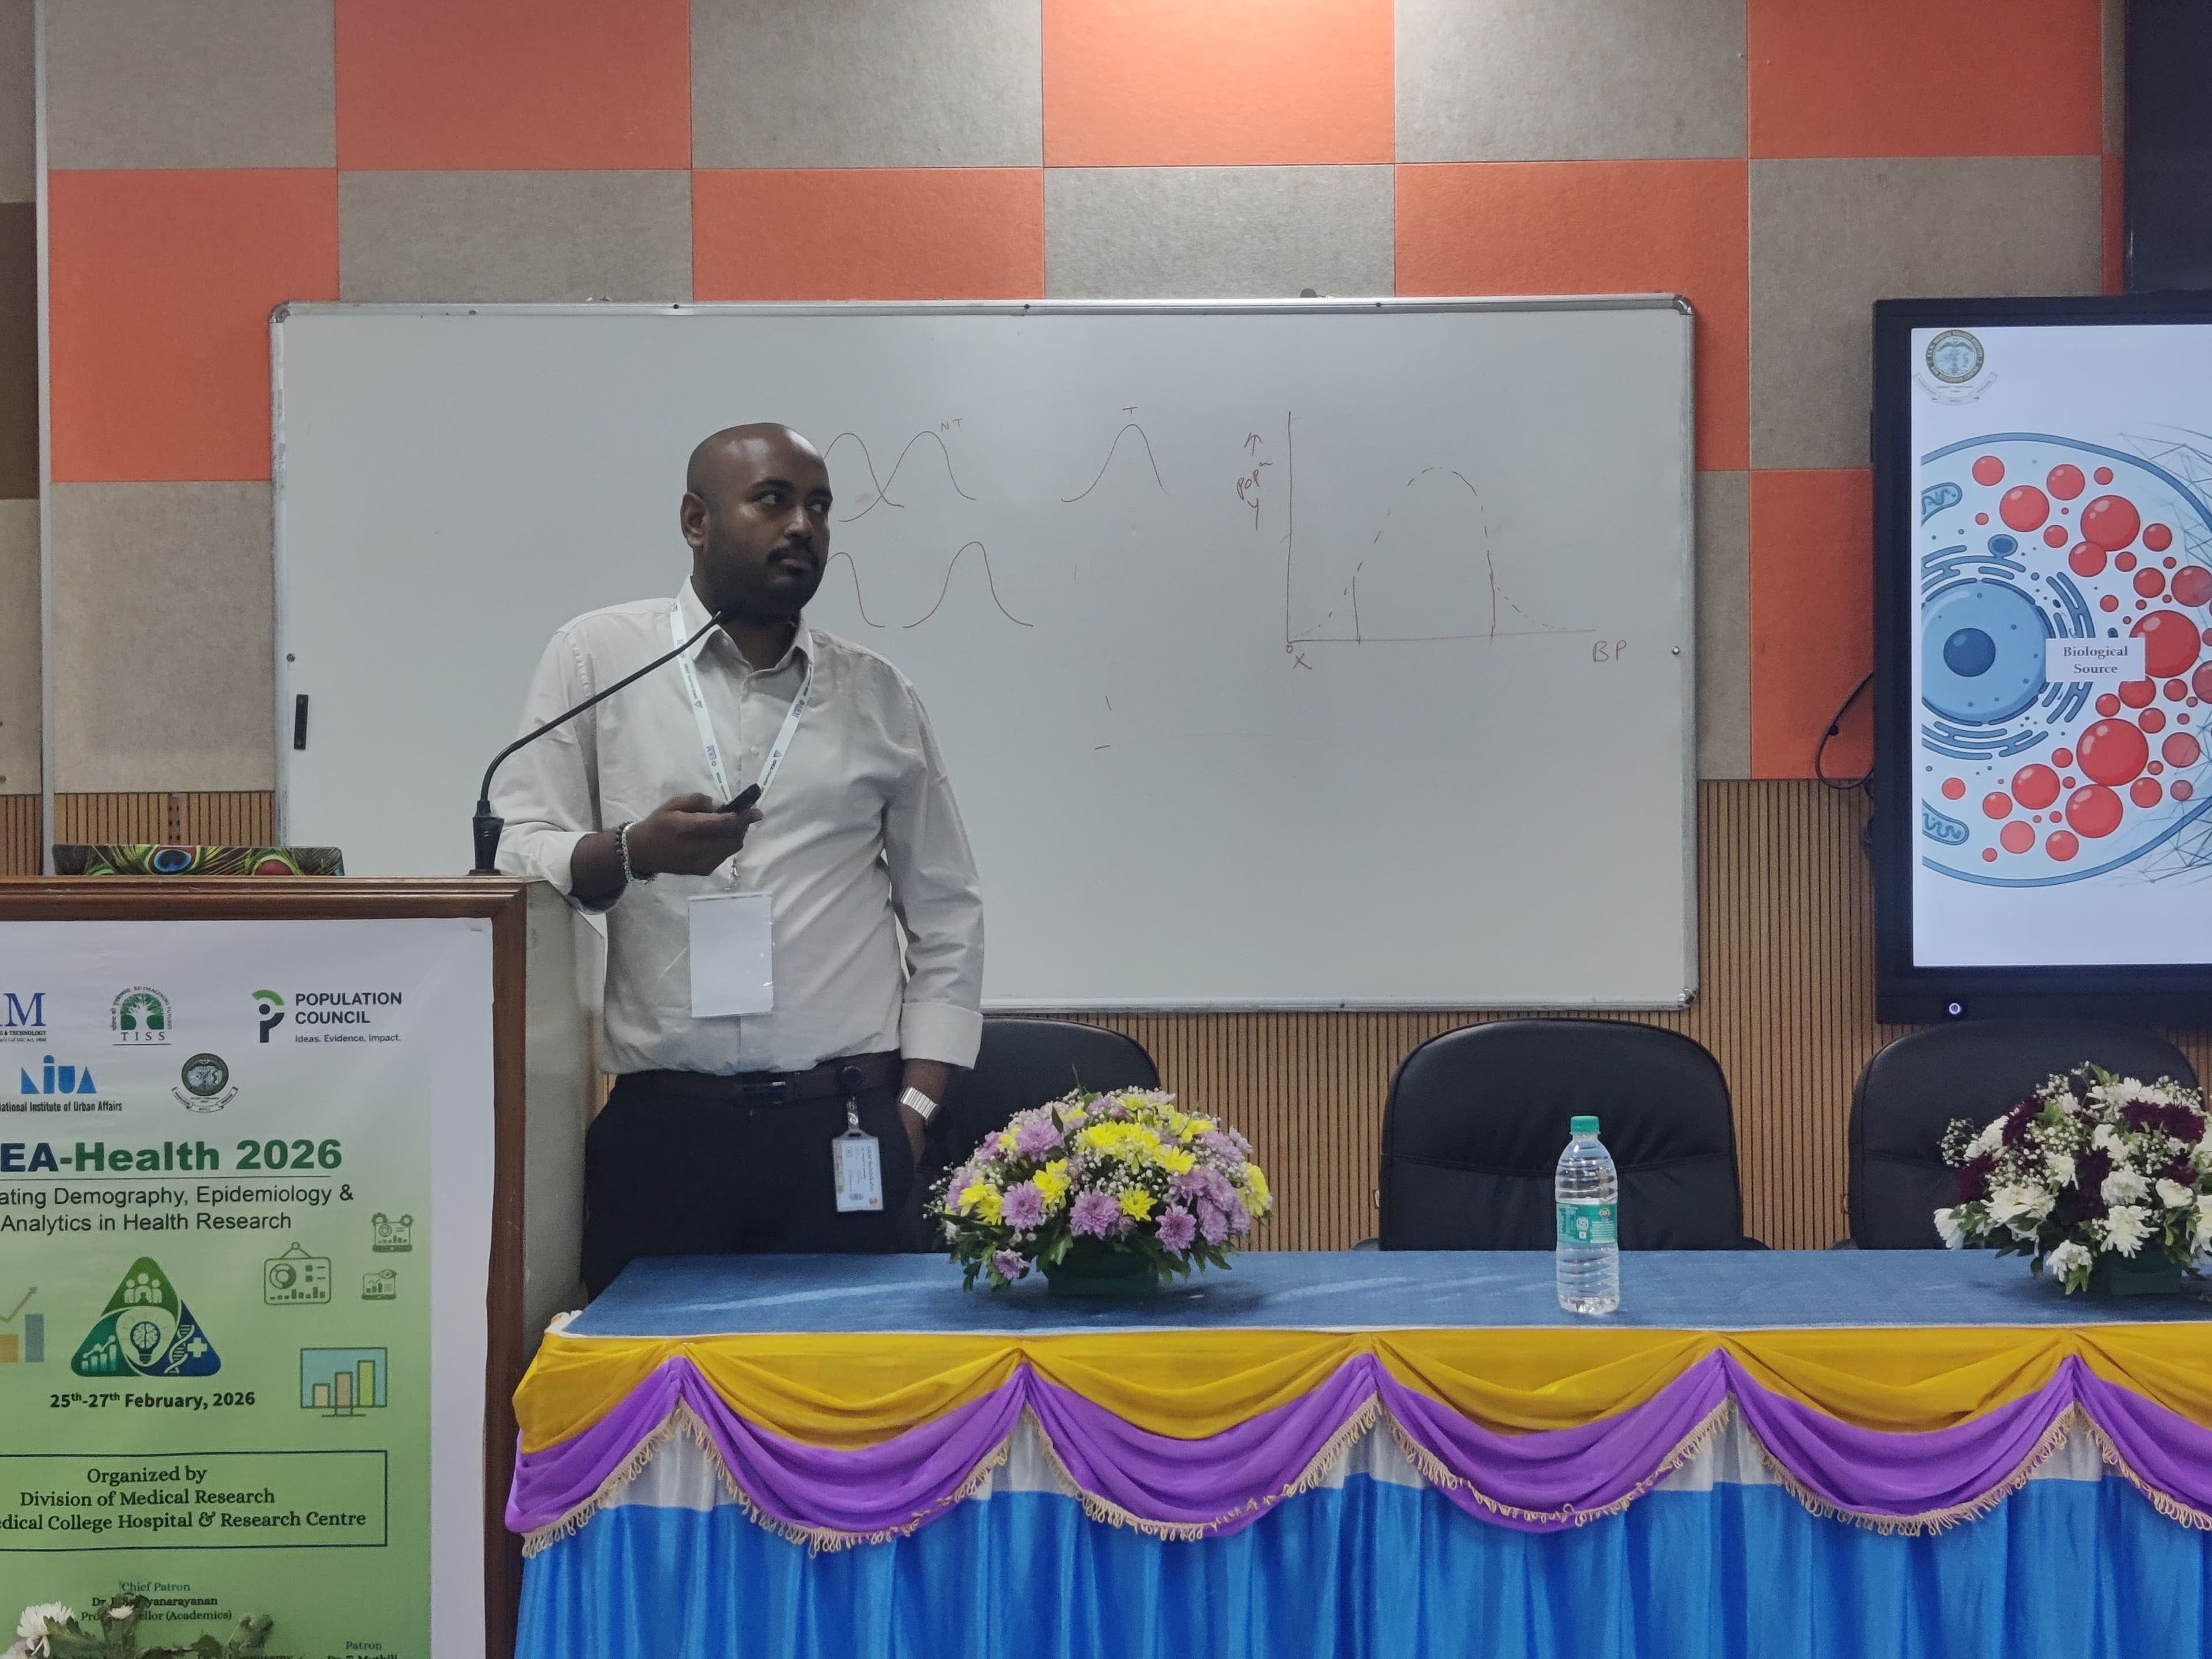
Engaging Workshop Sessions
Learning Qualitative Analysis
Hands-on Biostatistics Training

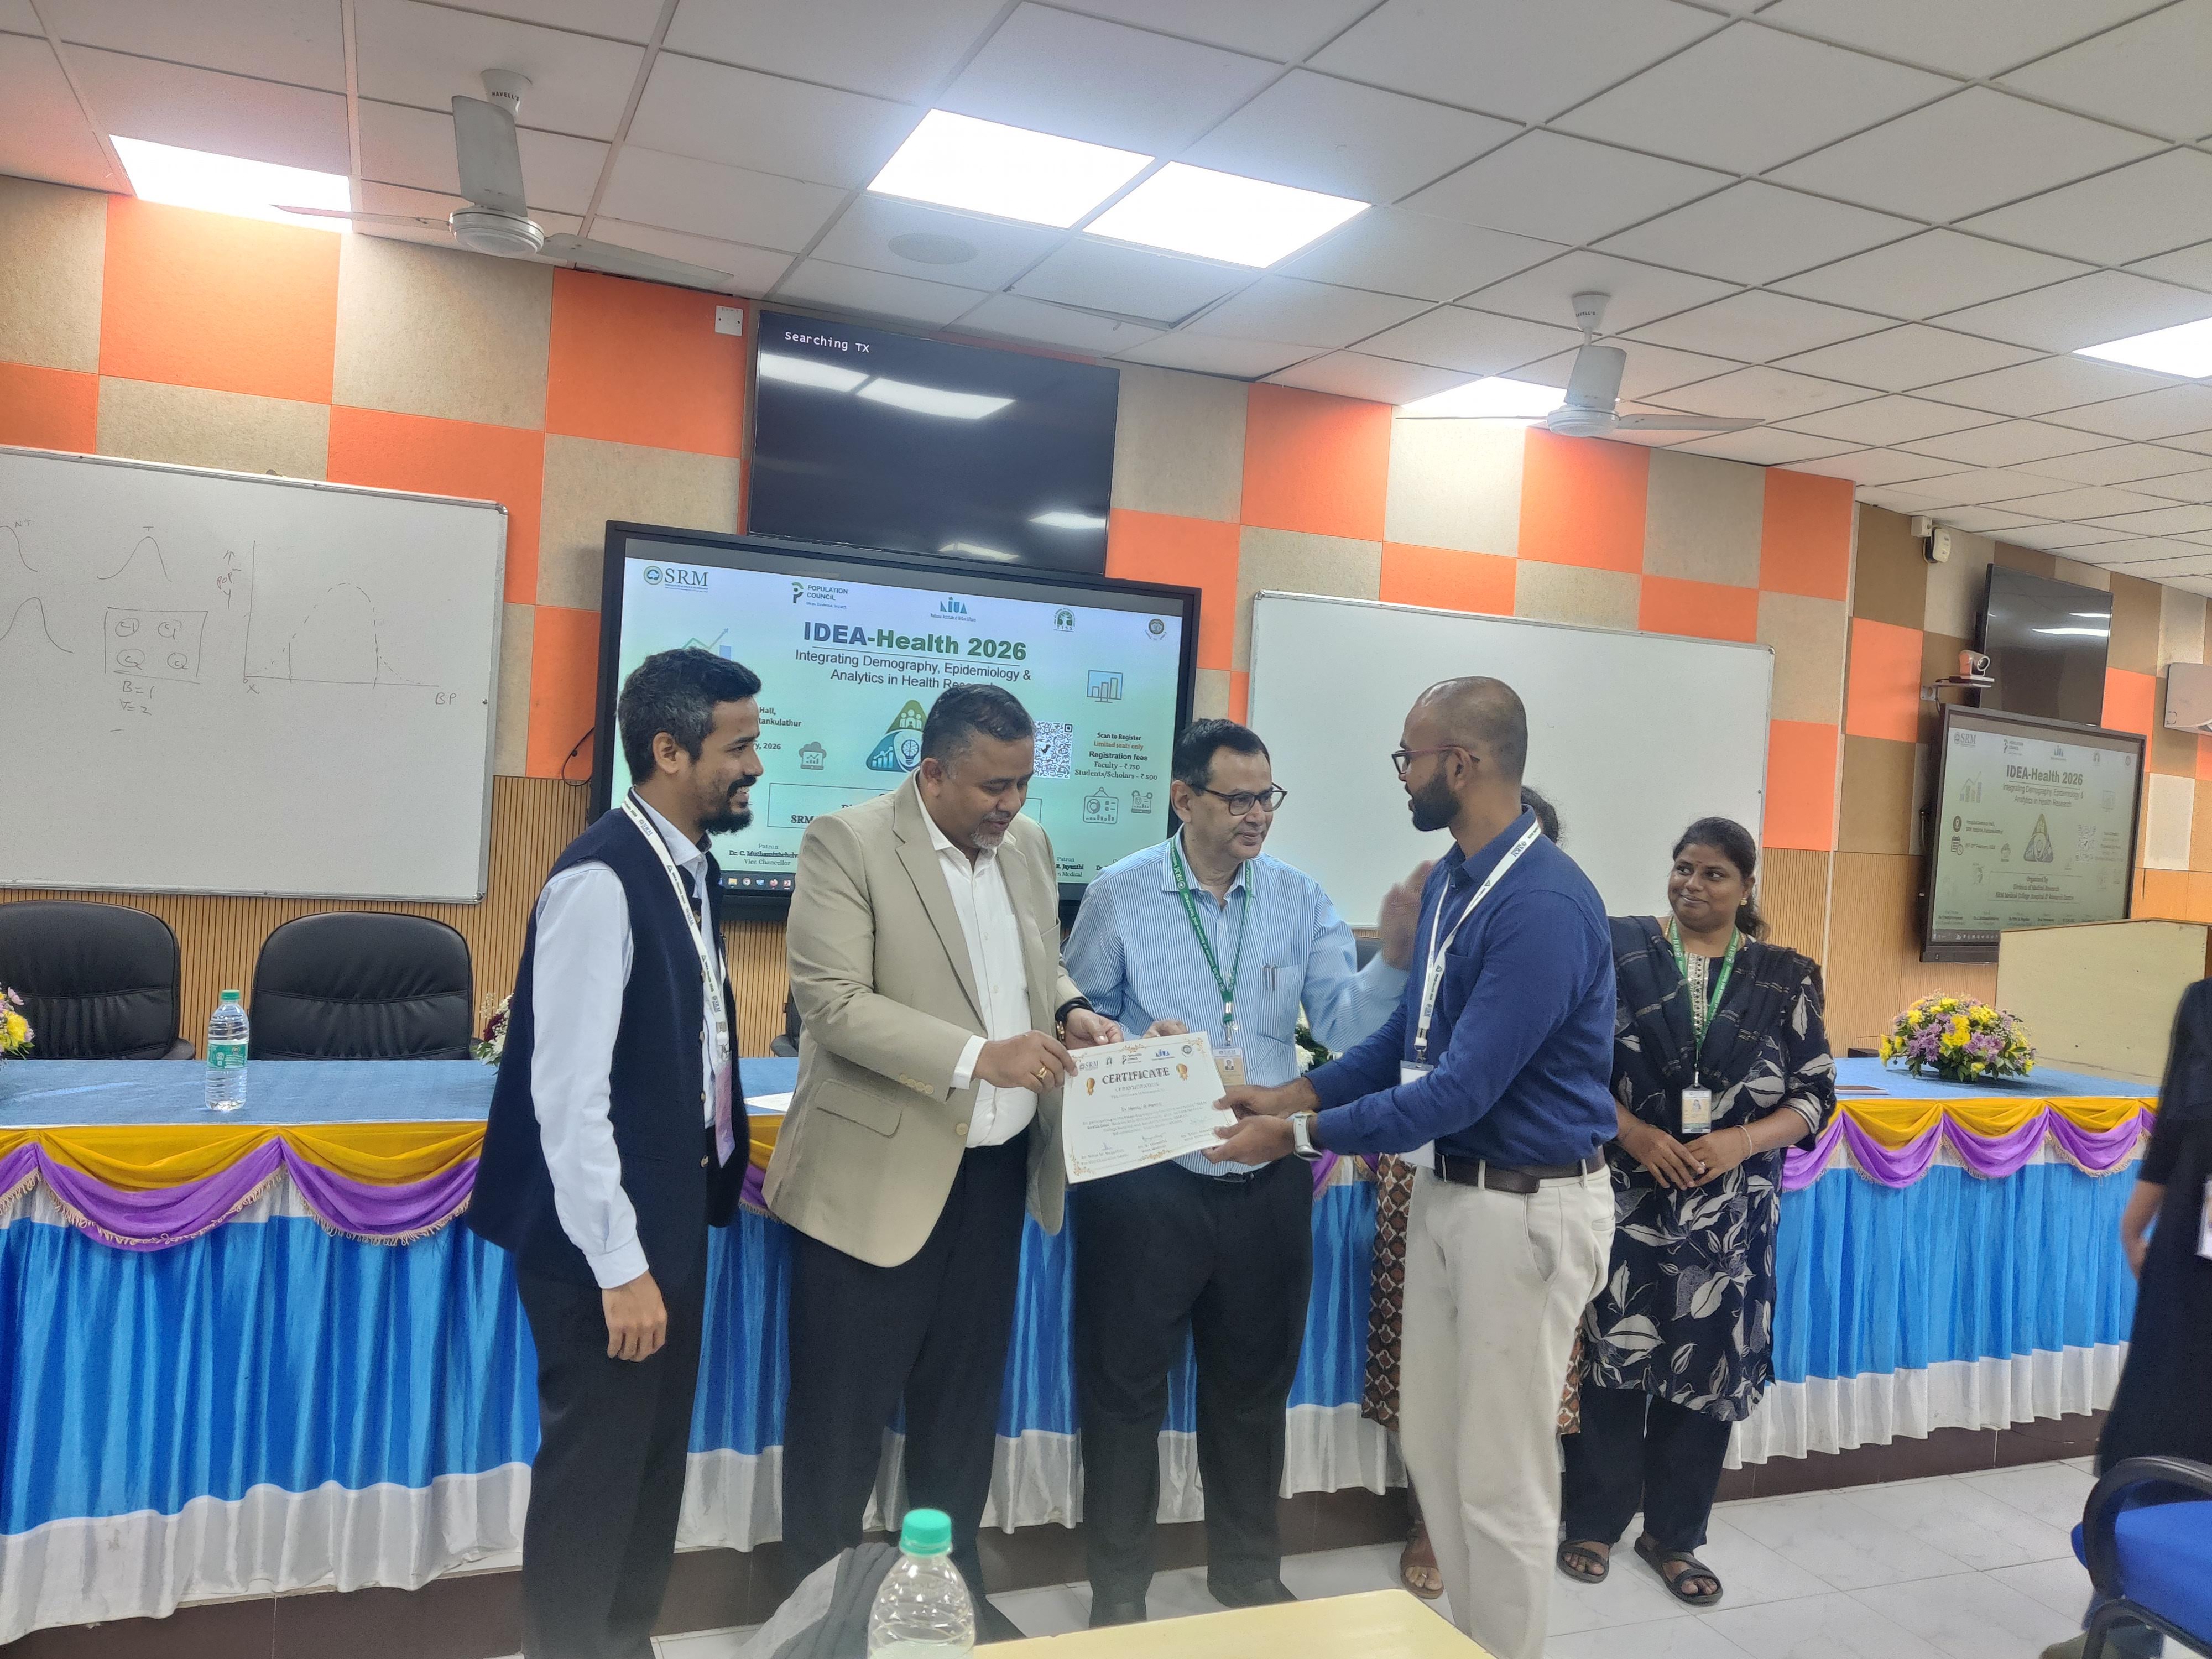
Receiving the Certificate
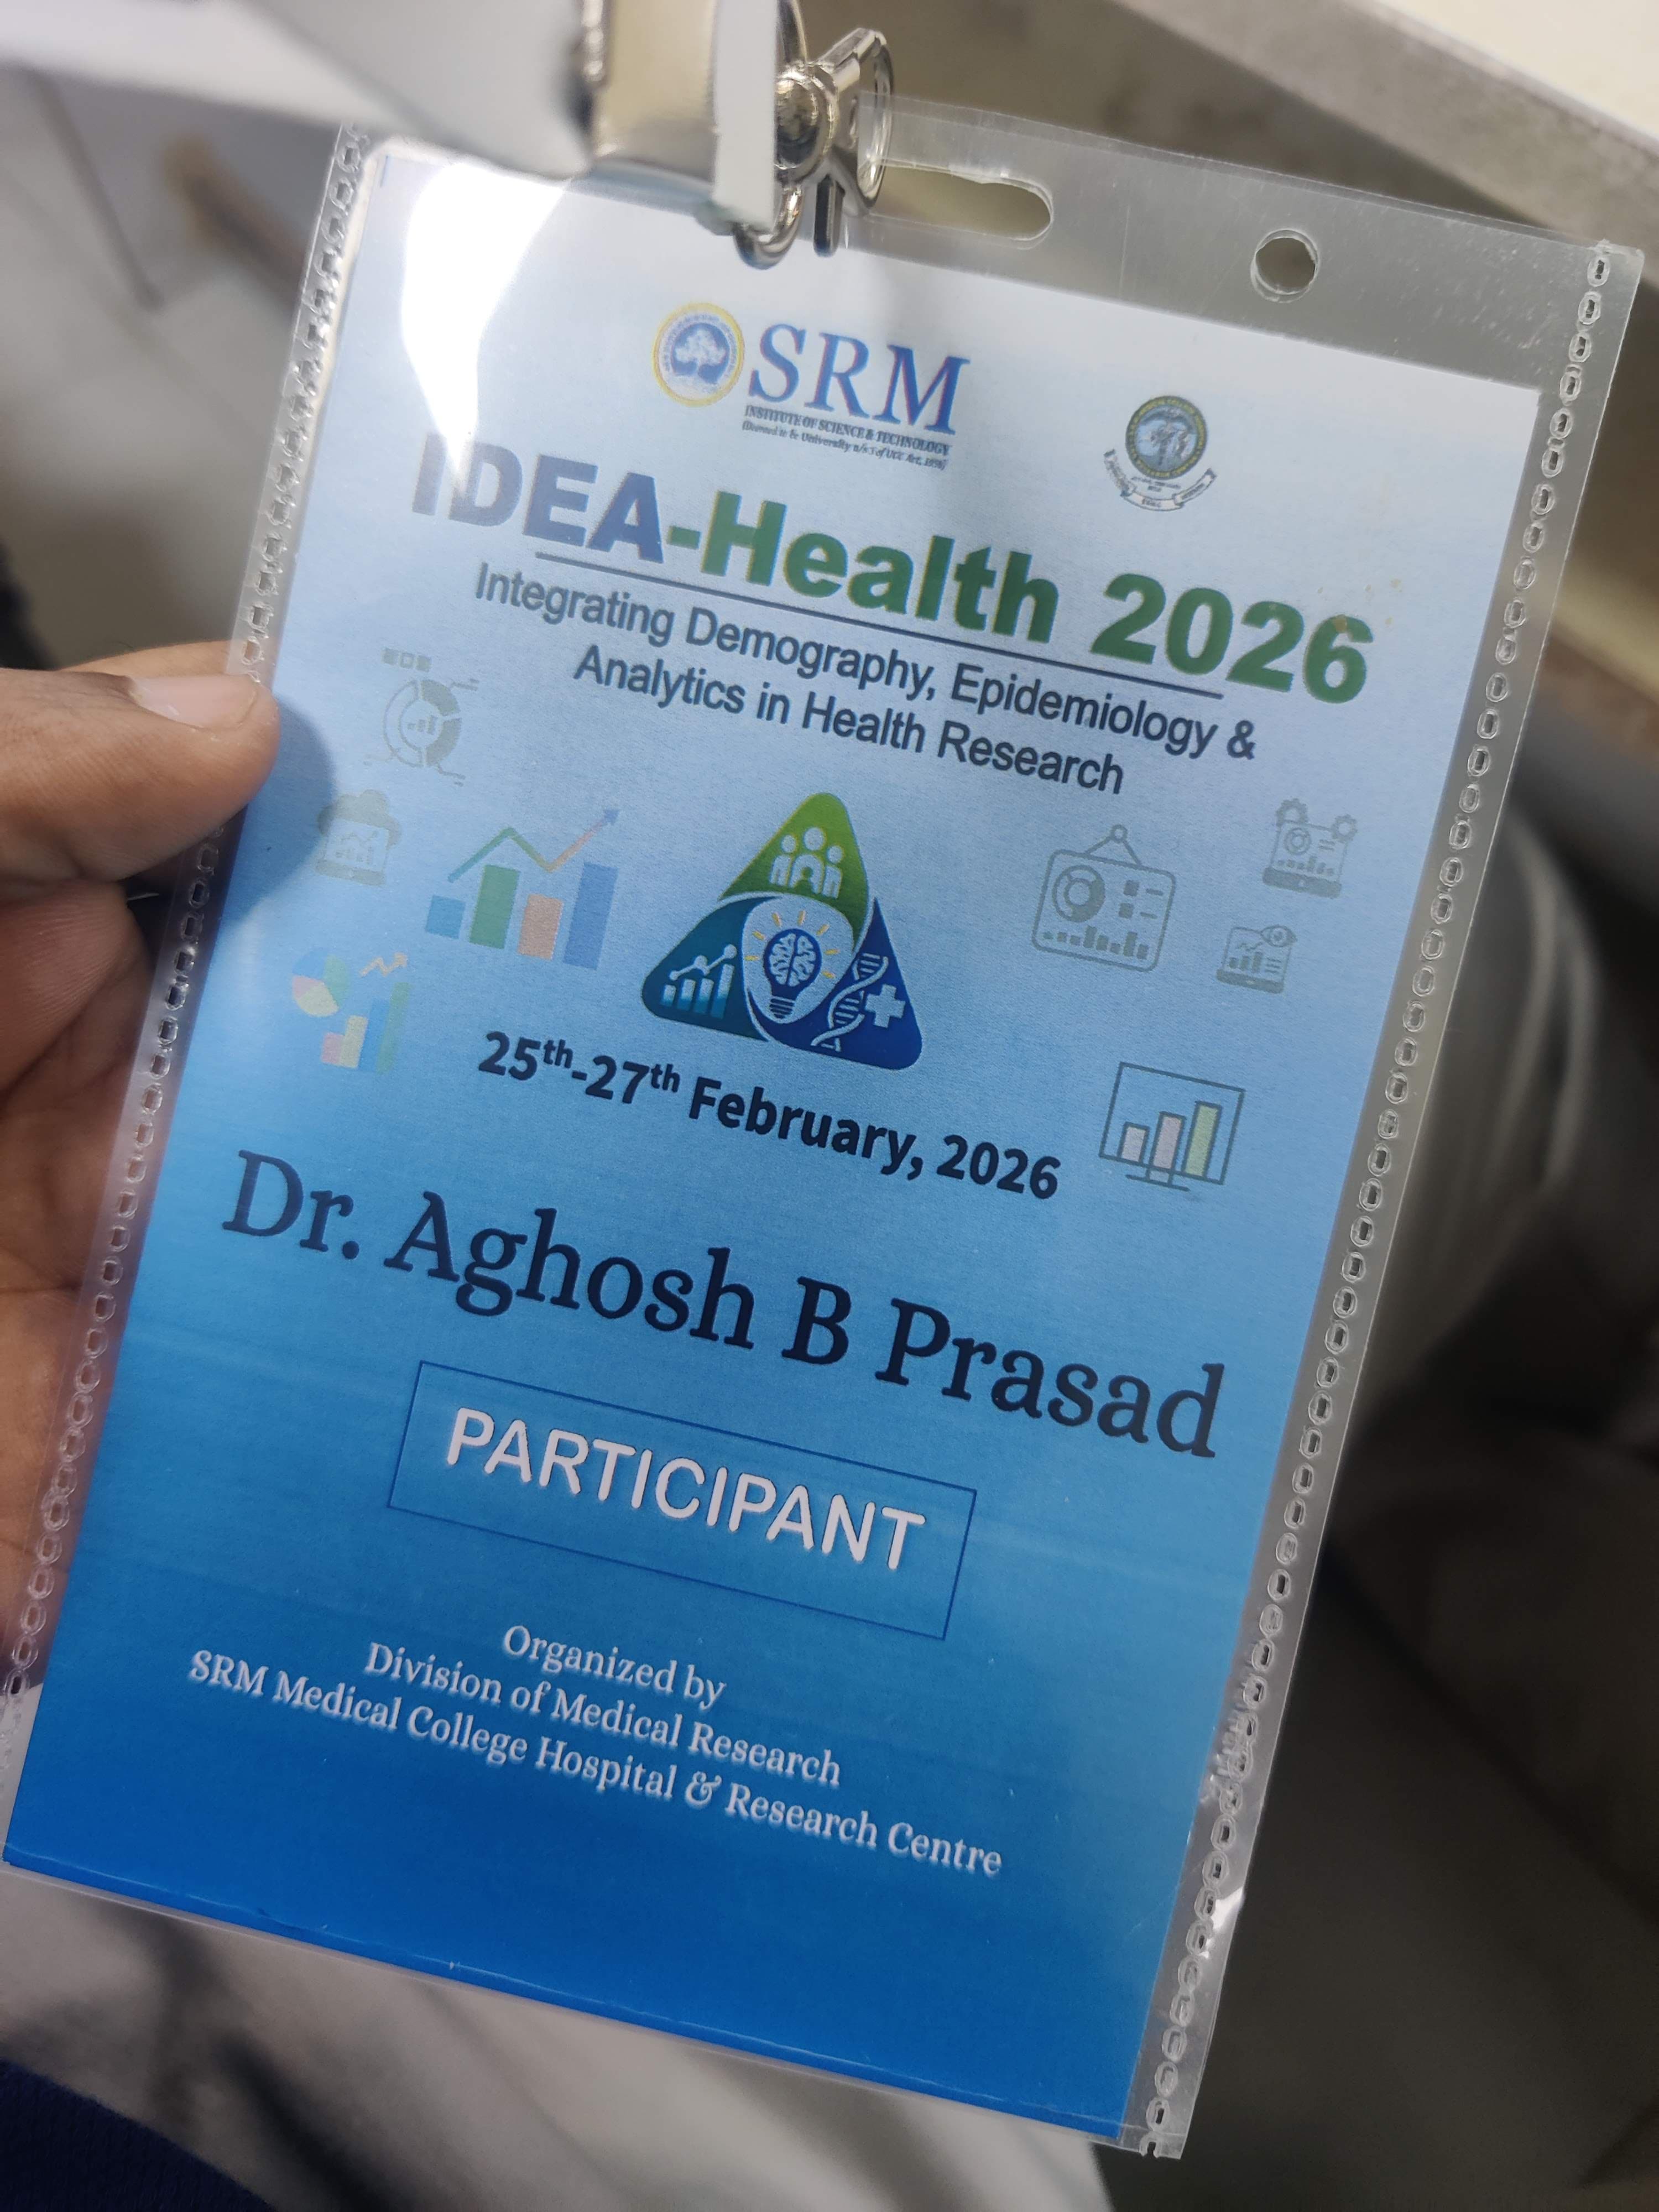
Event Lanyard